PERSONAL TOOL · IN PRODUCTION · 2026
Investment Assistant
A production dashboard for my multi-market portfolio — built for me, and for my agent.
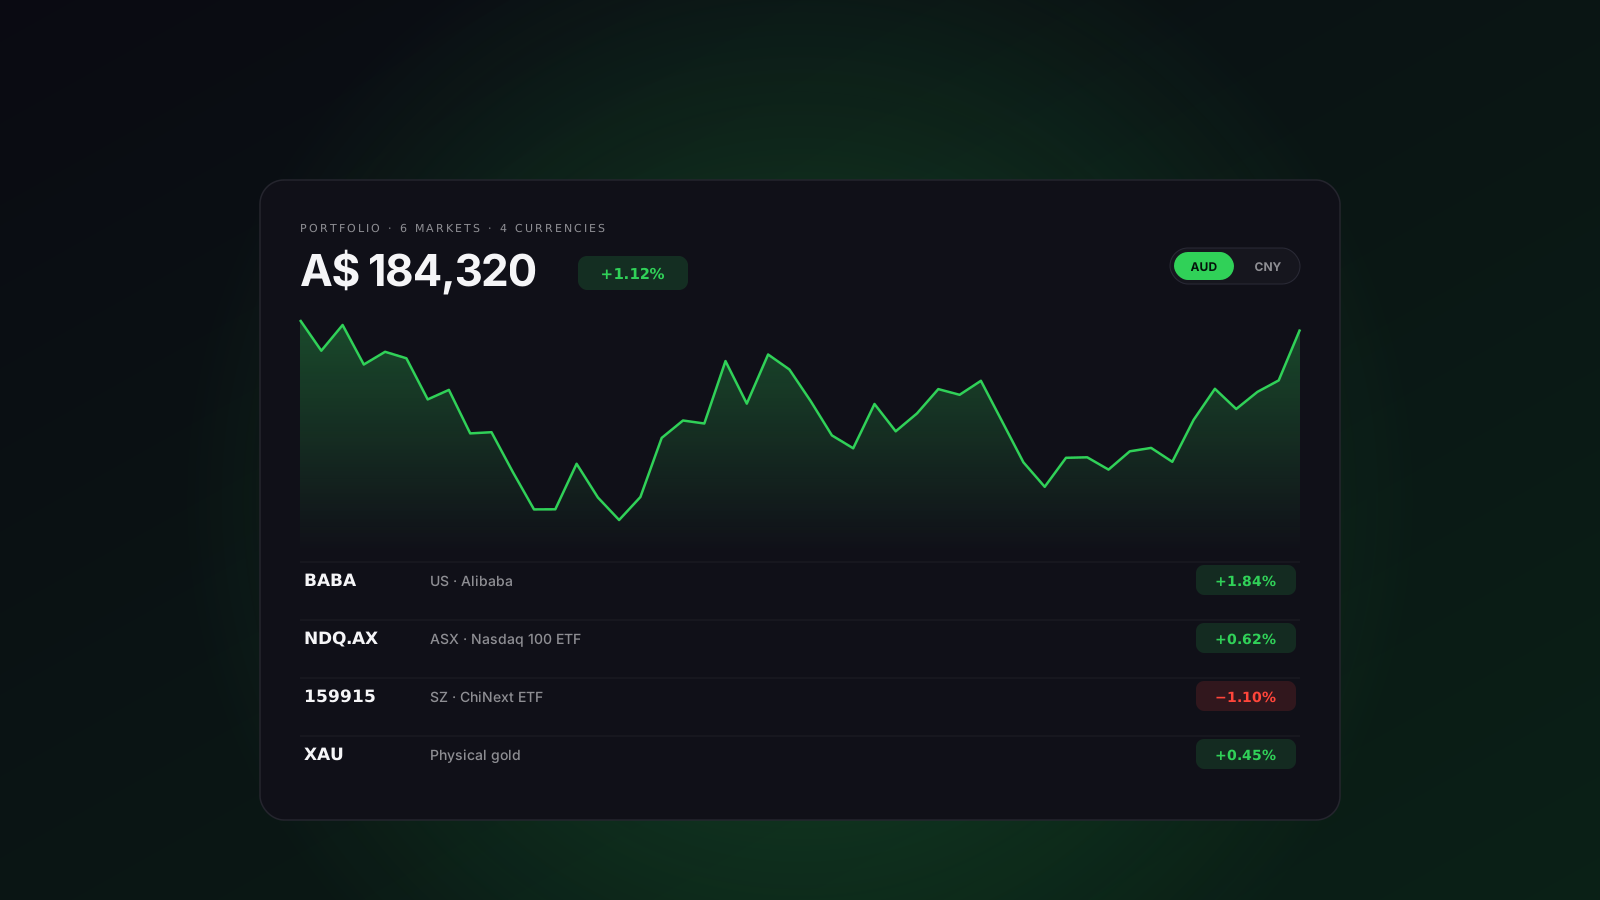
A production dashboard for my multi-market portfolio — built for me, and for my agent.
My holdings are scattered across US stocks, A-share ETFs, Hong Kong, mainland funds, the ASX and physical gold — in four currencies. This is the one place they all add up.
Six market types, four currencies (CNY · AUD · USD · HKD), converted via direct, inverted or cross-via-CNY FX rates — one total that actually means something.
The transactions ledger is the single source of trade entry: buys update weighted-average cost, sells accrue realized P&L, and day P&L stays correct even when I trade the same day — measured against my fill, not yesterday's close.
A cron job computes each day's P&L 15 minutes after the US close and paints it green or red on a calendar — the shape of a month at a glance, with win/loss day counts.
Per-currency deposit and withdrawal logs track how much principal actually lives in each market — so returns are measured against real money in, not guesses.
Tencent qt for A-shares and HK in one batched call, yfinance for US/ASX/FX, akshare for fund NAVs and Shanghai gold. Every source is wrapped: a dead feed marks its rows 'no price' — it never breaks the refresh.
Every weekday at 09:20 Beijing time — ten minutes before the A-share open — a scheduled Claude agent reads four API endpoints and writes me a pre-market briefing. The dashboard was designed to be consumed by an agent as well as a person.
The dashboard below mirrors the real app's interactions. Holdings, prices and P&L are all fabricated for this demo — but the currency switcher, ledger, calendar and live updates work like the original.
| Name | Qty | Price | Day | Value |
|---|
Everything runs in one Railway container — Flask, the scheduler, and SQLite on a persistent volume. Two things read it: me on my phone, and a scheduled Claude agent every weekday morning. Tap a node to see why each choice was made.
Click on any block in the diagram to see what it does and why I picked it.
Every mutating route requires a bearer token; GETs stay public so the morning agent can read without credentials. A deliberate trade for a single-user tool — the next step would be a signed agent identity.
An earlier version had a snapshot subsystem and an equity-curve chart. When I simplified the app, the chart ended up with zero callers — so I retired the whole subsystem instead of keeping dead weight. The calendar answers the real question: what kind of month was it.
Runtime failover for HK quotes (Tencent → Yahoo is supported but not wired), and surfacing the two-clock model in the UI — the ET trading day vs Sydney display logic is the app's subtlest code and deserves to be visible.